4. Roughness parameters (SuPy)
[1]:
import numpy as np
import matplotlib.pyplot as plt
import pandas as pd
import supy as sp
import warnings
warnings.filterwarnings('ignore')
4.1. Loading data, cleaning and getting ready for optimization
[2]:
name_of_site='US-MMS'
years=[2010,2012,2016]


df_attr=pd.read_csv('all_attrs.csv')
z_meas=df_attr[df_attr.site==name_of_site].meas.values[0]
h_sfc=df_zmeas=df_attr[df_attr.site==name_of_site].height.values[0]
folder='data/data_csv_zip_clean_roughness/'
site_file = folder+'/'+name_of_site + '_clean.csv.gz'
df_data = pd.read_csv(site_file, index_col='time', parse_dates=['time'])
# Rain
bb=pd.DataFrame(~np.isin(df_data.index.date,df_data[df_data.P!=0].index.date))
bb.index=df_data.index
df_data=df_data[bb.values]


df_data=df_data[(df_data['WS']!=0)]

df_years=df_data.loc[f'{years[0]}']
for i in years[1:]:
    df_years=df_years.append(df_data.loc[f'{i}'])

df_val = df_years.loc[:, ['H', 'USTAR', 'TA', 'RH', 'PA', 'WS']].dropna()
df_val.head()
[2]:
| H | USTAR | TA | RH | PA | WS | |
|---|---|---|---|---|---|---|
| time | ||||||
| 2010-01-01 00:00:00 | 21.873 | 0.739 | -8.08 | 70.503 | 98.836 | 3.695 |
| 2010-01-01 01:00:00 | 41.819 | 0.855 | -9.17 | 72.757 | 98.880 | 3.928 |
| 2010-01-01 02:00:00 | -6.078 | 0.699 | -9.63 | 72.611 | 98.910 | 3.088 |
| 2010-01-01 03:00:00 | -16.788 | 0.581 | -10.03 | 73.868 | 98.970 | 3.623 |
| 2010-01-01 04:00:00 | 5.006 | 0.562 | -10.36 | 74.242 | 99.030 | 3.474 |
4.2. Running supy to calculate z0 and d
[3]:
z0,d,ser_ws,ser_ustar=sp.util.optimize_MO(df_val,z_meas,h_sfc)
4.3. Calculating model wind speed using logarithmic law
[4]:
def uz(z0,d,ser_ustar,z_meas):
    z = z_meas
    k = 0.4
    uz = (ser_ustar / k) * np.log((z - d) / z0)
    return uz

ws_model=uz(z0,d,ser_ustar,z_meas)
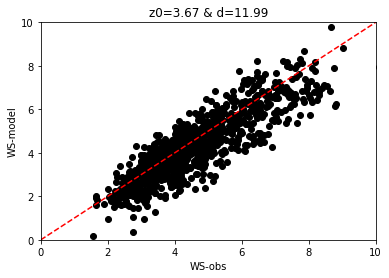
[5]:
plt.scatter(ser_ws,ws_model,color='k')
plt.xlabel('WS-obs')
plt.ylabel('WS-model')
plt.title(f'z0={np.round(z0,2)} & d={np.round(d,2)}')
plt.plot([0,10],[0,10],color='r',linestyle='--')
plt.ylim([0,10])
plt.xlim([0,10])
[5]:
(0.0, 10.0)